When you see the bright red negative percentage next to your bond fund, you might reasonably question how much it’s contributing to your portfolio. Reviewing bond fund gain/loss percentages causes some of the most common client questions. To address this, we’d like to share what really goes in to a bond fund’s total return and how you should evaluate it.
Price fluctuations
Price fluctuations are pretty easy to see on your account statements. If the share price goes up, your market value goes up, creating a gain. The converse is true, too, and that’s where we tend to hear the most complaints about bonds “losing money.” And you might be seeing that red number in your unrealized gain/loss column showing a loss like the one below:
Prices of bond funds are driven primarily by interest rate changes. If interest rates have gone up since you purchased the fund, you probably have a loss. If interest rates have gone down since your purchase, you probably have a gain.
Thankfully, there is more to the total return equation when assessing a bond fund. While looking at the unrealized gain/loss column on your statement tells most of the story for your stock funds, it’s missing a huge component for your bond funds: income. Failing to consider the interest income generated by the bond fund results in undercalculating its return and contribution to your portfolio.
Interest income
This is where the bond funds shine! If you’re in a bond fund, you will probably be getting the majority of your return from interest, or coupon payments. These payments are included when calculating the total return of the bond fund and what it contributed to your portfolio. They are not included when looking at the unrealized gain/loss which only includes price change.
If you rein vest these interest payments into the same bond fund, it adds to your cost basis (what you originally paid for that investment) and is reflected in the market value, as well. When you reinvest, you buy additional shares of the bond fund that could benefit from both the price fluctuation and compounding interest.
If the interest payments get paid out in cash, it’s a little cleaner to see your total return. To do this, you add the price fluctuation and the interest paid together, then divide it by your original investment.
Total return
Total return is the sum of price change plus interest income. This is the metric that should be used in evaluating a bond fund’s contribution to your portfolio performance. If you don’t want to calculate the total return yourself, your custodian probably offers other views for gauging performance. You might come across something that looks more like this:

This Fidelity fund data goes all the way back to 3/8/1990 when the fund was started with an average 5.05% annual rate of return. That’s 35+ years of data. Bond funds are not without risk. They can still lose money, but as long-term investors, we know those losses tend to be relatively short-term.
Bond fund performance examples
Let’s look at the two components of bond fund returns for the past 5 years with a popular example — Vanguard Intermediate Term Investment Grade (VFIDX).*
Example 1:
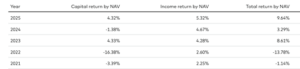
If you purchased the fund on January 2, 2025 and sold it on December 31, 2025, you had a 4.32% profit from the change in price and a 5.32% profit from the income resulting in a 9.64% total return. For reference, interest rates went down in 2025, resulting in the profit from change in price.
Example 2:
You purchased the fund on January 3, 2023 and sold it on December 31, 2025. You purchased it for $8.36/share and sold it for $8.93/share. Based on the price change, you had a 6.8% total profit for the 3 years. When you include the income, you had a 7.14% average annual rate of return.
Example 3:
You purchased the fund on January 4, 2021 and sold it on December 31, 2025. You purchased it for $10.47/share and sold it for $8.93/share. Based on the price change, you had a 14.7% loss. When you include the income, you had a positive return of .95% average per year. Interest rates increased steeply in 2022 resulting in the loss from change of price. However, by fully considering the total rate of return, you can accurately assess that the fund still managed to have a positive return over the 5-year period.
Bottom line
This chart from Vanguard shows the year-by-year returns from both components for VFIDX:
Please see the link to Vanguard’s website for full calculation methodology.
If you purchased your bond funds before the rapid rate jump in 2022, they are probably showing a loss in your unrealized gain/loss column. But, when you include the income generated, it’s a dramatically different picture.
Bond funds are not without risk. They can still lose money, especially when interest rates rise rapidly. As long-term investors, we know those losses from interest rate changes tend to be relatively short-term.
Still not sure about bond funds?
We get it if you’re still not sure about bond funds. We don’t expect them to have the same return as stock funds. Stocks will always have higher return potential. We recommend bond funds in a portfolio to manage the risk and control volatility. How much of them you should hold depends on your life stage and comfort with risk. And when you’re evaluating bond funds, it’s important to consider their full contribution — both interest and price change to get the full picture.
By this time, you can probably guess at our answer to the question: are bond funds as bad as they look? Definitely not. It’s important to understand the full picture in evaluating them and their role in your portfolio.
If you’d like to discuss whether bond funds belong in your portfolio, please contact us.
*Source for FXNAX price and historical performance is Fidelity as of 1/15/2026. Source for returns for VFIDX is Vanguard as of 12/31/2025. Source for VFIDX prices is Yahoo Finance as of 12/31/2025.